
The Score Card tool enables you to provide a summary of important information on a single page on a chart or grid. For example:
You can create a new score card from the General ribbon bar by selecting New > Score Card. This displays a new, blank score card which you can use to display Key Performance Indicators and host the following four types of report tools:
Please note that unlike other reports Scorecard results will by default show nulls and zeros.
After you have created the score card, you can customize the color palette and other display settings using the Score Card tab.
To create a new Score Card
On the General Ribbon bar, select New > Score Card or open the Score Card reporting tool in the Workspace.
Flip the Score card over to manually configure the settings. For example:
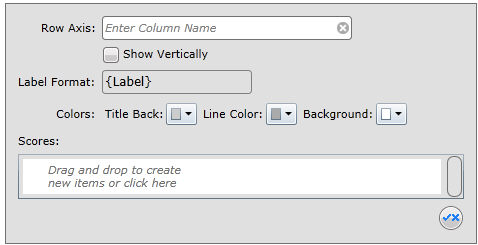
If you require a multi-dimensional score card then you must also specify a column in the Row Axis field. This could be anything from periods like ‘Month’ or ‘Quarter’ to geographic regions or product breakdowns.
Configure the following, remaining fields:
Show Vertically: Check this if you would like the score card results to be displayed in a vertical grid rather than the default horizontal layout.
Label format: If you have configured a row axis then by default, the grid will be labelled by the selected row axis. You can override this by entering a label.
Colors: Edit the display colors by selecting options from the drop-downs.
Scores: Single score tools can be added by drag and drop, or you can click into the field to select the type of score you want to add. For example:
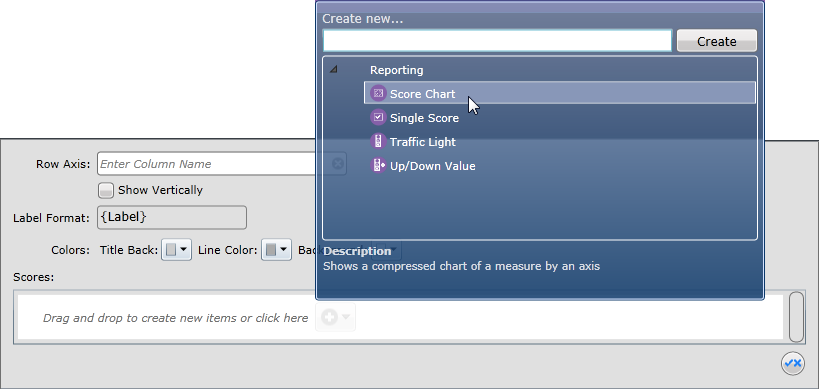
See the individual tools for instructions on how to configure each.