A Score Card tool which indicates the status of a field value based on predefined ranges and corresponding colored indicators, for example:Green, Amber, Red.
It is designed to be used in a score card to provide an immediate visual indicator, for example when a key performance indicator is out of a defined ‘acceptable’ range.
Adding a Traffic Light to a Score Card
Drag the Traffic Light tool to the Score Card Workspace, over the Add Score tab. Alternatively, flip the chart and manually add the Traffic Light score.
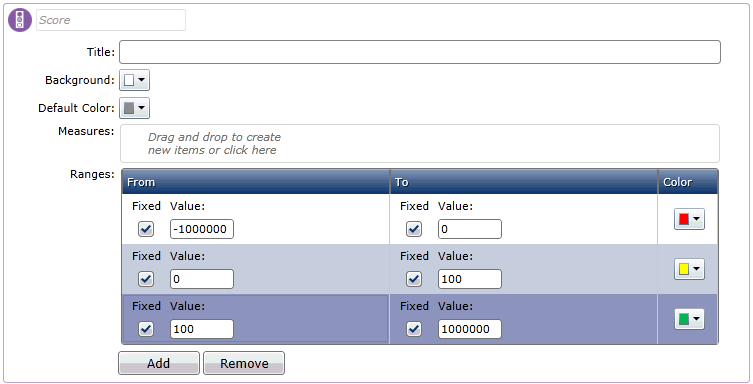
A new traffic light score is added, which you can configure in the Scores area when you flip the Score Card. For example:
As illustrated above, the traffic light score is configured with the default ranges represented by red, amber and green colors.
Add a suitable ‘Title’ which will appear on the Score Card.
Edit the background and default colors as appropriate.
Drag the measure column from the Data Explorer that will form the basis of the traffic light and drop it in the Measure field. This displays the Measure Configuration window from which you configure aspects such as the function used for the measure.
Configure the default ranges and traffic light colors as required. The following options are available:
Fixed: When this option is selected, you must enter a specific 'From' or 'To' value, as required.
Percentage value: Deselecting the 'Fixed' option enables you to specify a percentage value of a measure for the range.
Color: Use this drop-down menu to select the required color for the range.
You can also add and delete ranges are required, using the buttons below the Ranges table.
Flip the configuration window to view the final result on the Score Card. For example:
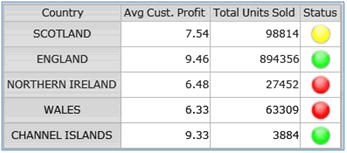
Note: The Score Card displays the traffic light color and not the actual value. If you want to see the value in addition to the visual indicator then consider using the Indicated Value tool instead.