Clicking the configure icon ![]() at the
bottom right of a chart will flip it over to display the configuration
settings. Some of the options available on this screen can also be achieved
using drag and drop to the chart area. Actions like naming, adding a chart
title, and adding additional filters can only be done on this screen.
For example:
at the
bottom right of a chart will flip it over to display the configuration
settings. Some of the options available on this screen can also be achieved
using drag and drop to the chart area. Actions like naming, adding a chart
title, and adding additional filters can only be done on this screen.
For example:

The following fields are available on the Chart Configuration screen:
Name: his is a unique identifier for the chart. It is not a mandatory field and does not appear on the chart itself, but is useful for uniquely identifying charts on a dashboard, and when linking documents. It is not the same as the document file name, which the user will specify when saving a chart.
Report Source: This drop-down shows the configured report sources. Where multiple sources are available, these will appear in the drop-down list allowing you to quickly change the basis of the chart.
Clicking the icon ![]() will display
the standard report configuration screen that
is used throughout the Campaign Manager application. It is described here
in the context of charts:
will display
the standard report configuration screen that
is used throughout the Campaign Manager application. It is described here
in the context of charts:

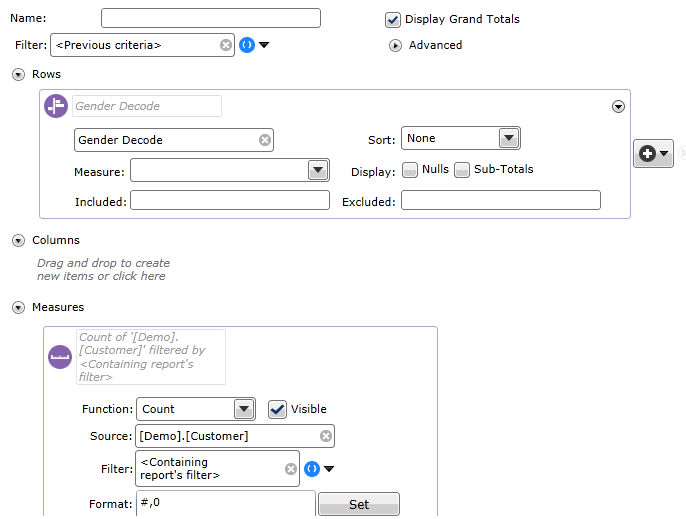
This screen contains the following configuration fields:
Name:This is the name of the chart configuration, and is what will be displayed in the ‘Report Source’ drop-down once saved. Note that additional report sources can be added to the chart by dragging the Report tool to the workspace.
Filter: By default the chart will be filtered by previous criteria, in other words it will display the segment that is available to it from the document in which it appears.
Additional filters can be added with this option that are unique to the chart configuration. These will be joined at the chart level by the specified join option and at the report level by the join option that is specified for the entire chart.
If multiple filters have been added, check the ones that you want to include in the current iteration of the chart, and be sure to set the join option of each. Unchecked filters will be ignored.
Advanced: Expand the Advanced options to configure the Column / Row Axis and Suppress Blank Columns / Rows settings.
There are now three available items that can be added - Columns, Rows and Measures.
Columns and Rows (optional): Drag a column from the Data Explorer, or alternatively use the ‘Create new...’ drop-down to select another tool to engineer a column, or to add an existing template.
When dragging columns from the Data Explorer, columns and rows are configured using the Dimension configuration settings.
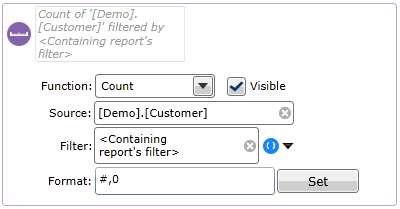
Measures (mandatory): This option allows you to define the basis of the chart, i.e. what you are actually measuring, and it is mandatory to configure at least one measure. It could be a simple count of a table i.e. Customer, Household or Order, or it could be something like a mean, or the sum of a database column. More complex measures can be created using the Calculated Measure tool.

For a simple count, select a function of ‘Count’ and from the ‘Source’ drop-down select the relevant table. This is the equivalent of setting the default resolution level using the drag and drop ‘count’ operation described above.
For more advanced measures, select a function from Sum, Average or Standard Deviation and then select the Source column that the function will be based on.
Note: Multiple measures can be added to a chart, allowing the user to select the one that they want from the Measure drop-down menu in the main chart configuration options.
The 'Visible' check box is intended for use with calculated measures where one measure may be used by another, but wouldn't be displayed on it's own in the final report. In this case you would uncheck the box.
You can also add additional filters at the measure level (by default charts will be filtered by the report level filter where one exists). Measure level filters are unique to the measure they are part of and are AND’d with the report filter by default. Where multiple measures have been added to a report, then each can be filtered differently allowing comparisons to be made.
To add a measure filter, first clear the <Report Filter> default by clicking the cross icon. If you then click the drop-down you will be able to drag and drop filters or click the ‘Create new...‘ menu to build up the filter from the available options.
Chart Title: This is the title of the chart that will appear at the top. It is not a mandatory field and does not have to be unique.