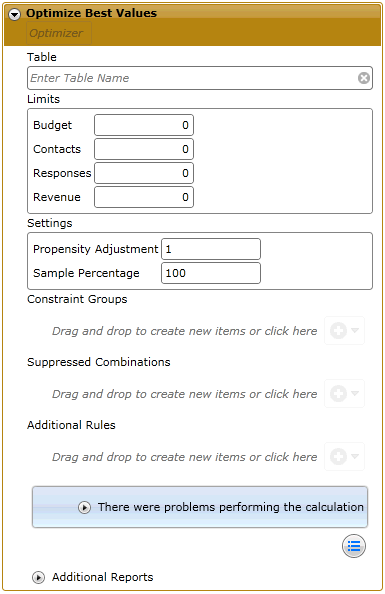
This is an optimization tool that uses optimization models to calculate the best combination of products and channels to achieve maximum return on your marketing budget. The user inputs a combination of budget, contact, response and revenue limits, and the system outputs a detailed matrix of suggested channels and volumes.
Creating an Optimization Model
Drag the tool to the workspace or select it from the 'Create New' dropdown.
The following screen will be displayed:
Table
This is the database table that the optimization will be performed on. It will usually be a customer table or equivalent.
Global Limits
These are the hard limits/targets that we are imposing for the calculation of our model. These are not mandatory, but may include the available marketing budget, the total number of contacts we wish to make, the number of responses we would like to make, and the total amount of revenue that we are intending to earn. Note that these are global limits - limits on individual channels and groups can be set separately.
Settings
Propensity Adjustment:
Sample Percentage: This is the percentage of the dataset that the model will be run for. The default 100% will run it for the whole dataset, but this can be adjusted by changing this percentage.
Constraint Groups
This is the area where we specify the products that will be included in our optimization, and the channels that will be used. You can include one or many constraint groups, though note that each individual recipient will get one value for each constraint group that has been set up.
Click the 'Create New' dropdown under the Constraint Groups section and select the Constraint Group tool. Type a name for the group into the field provided and then click the dropdown to the left of the field to expose an area where you can drag items from the Data Explorer. You can drag an entire column which will automatically create constraint groups for each value in the column, or you can select the Constraint Item tool to add values individually.
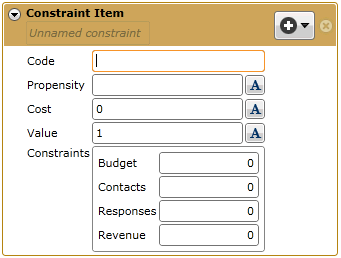
The Code and Propensity fields will be automatically populated when you create an item using drag and drop. The code will be derived from the column value that you have selected, and the propensity model will be automatically created for that item using all the columns available on the selected table. You can click on the dropdown to view the model and delete any columns that you don't require. This is advisable as a lot of extraneous columns will slow down the model and make it more difficult to analyze results.
Cost: This is the cost of sale for this item.
Value: This is the value of a sale of this item.
Constraints: These are the same constraint options available at table level, but will obviously only apply to the individual item.
Suppressed Combinations
This option can be used to suppress specified combinations of constraint groups, for example you could specify that certain products should never be marketed via the channel 'Email'.
Additional Rules
This option can be used to add additional complexity to your scenario by adding in rules which relate to specific groups and channels. These rules will overwrite any rules set up at the master level.
Click the 'Run Processes' button  to run the model.
When the model has finished processing the results will be displayed in a grid below.
For each Constraint Item a summary grid will display the recommended number of contacts along with the expected cost and the projected profit and revenue.
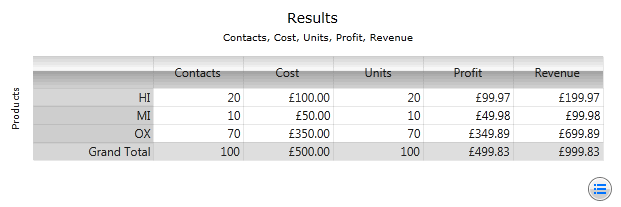
If you click on the Additional Reports dropdown below, a further grid will be displayed showing a further level of detail.