Charts and grids that contain multiple dimensions can have many rows and columns for each combination of dimension value. For example, when displaying a count of households by 'Title' and 'Gender', possible row combinations could be Gender = "Female", Title = "Mrs", or Gender = "Female", Title = "Miss" and so on.
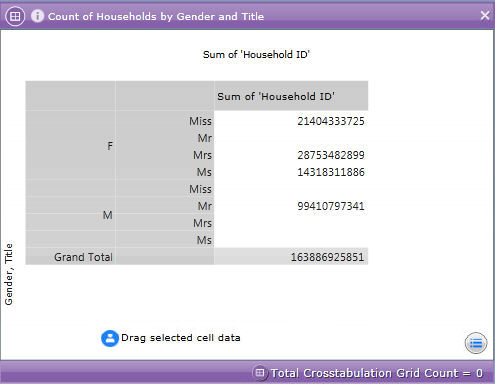
Setting the Advanced Column / Row Axis settings to 'Complete' displays every possible combination of dimension values on your grid or chart. For example:
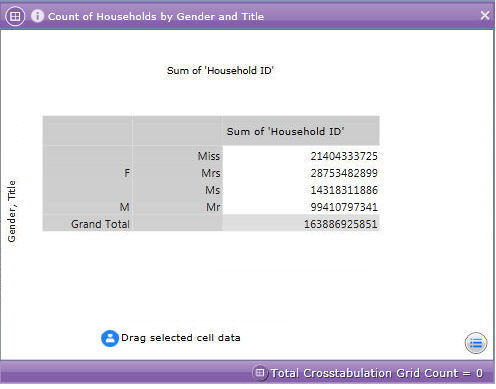
However, as illustrated above this can result in combinations of data being displayed that are not possible, for example Gender = "Male", Title = "Mrs". As such, the default Row / Column value is set to 'Normal' which means that an inferred hierarchy is created in which only valid combinations are displayed. For example: